 PA Trace for live sound
SPL monitoring at live shows
Many venues and festivals set a level limit, and the crew has a hearing budget too. Keeping to both means knowing which number the limit is written in, measuring it at the right place, and keeping a log that tells the story of the show. Here is what the numbers mean and a routine that works.
Updated 17 November 2026
dB SPL in one paragraph
Sound pressure level is pressure in decibels against 20 µPa, roughly the threshold of hearing at 1 kHz: Lp = 20·log10(p / 20 µPa). 94 dB SPL is a pressure of 1 Pa, which is why calibrators use it. Every 6 dB doubles the pressure; every 10 dB is heard as roughly twice as loud; every 3 dB doubles the energy, which is what hearing damage follows.
Frequency weighting: A, C and Z
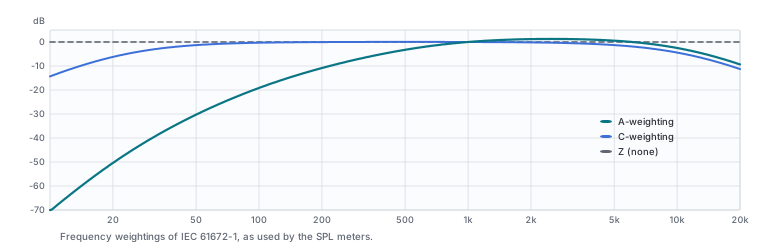
| Weighting | What it does | Used for |
|---|---|---|
| A (dBA) | Follows the ear at moderate levels and strongly reduces low frequencies | Most noise regulations and exposure limits |
| C (dBC) | Nearly flat, rolls off only at the extremes | The low-frequency energy of amplified music that dBA hides; many venue limits include a dBC value |
| Z | No weighting | The physical pressure across the band |
A show with heavy subs can sit comfortably inside a dBA limit and still shake the neighbors' windows. That is why a limit written in both, for example 100 dBA and 115 dBC, is common, and why you watch both.
Time weighting and averages
| Metric | Meaning |
|---|---|
| Fast | Exponential, 125 ms: follows the music closely |
| Slow | Exponential, 1 s: steadier, easier to read |
| Leq | The steady level with the same energy as the varying one over a time window. Most limits are written as an Leq over a stated time, such as 15 minutes. |
| Peak C | The highest C-weighted peak, for limits on impulsive peaks |
| L10, L50, L90 | The levels that 90, 50 and 10 % of the readings are below. L90 is the usual figure for background noise; L10 for the loud passages. |
| Exposure | The share of the allowed daily noise dose already received |
Exposure limits differ. NIOSH recommends 85 dBA for 8 hours with a 3 dB exchange rate: every 3 dB more halves the allowed time, so 94 dBA is about one hour. OSHA uses 90 dBA for 8 hours with a 5 dB exchange rate. Read the limit you are working under and set the meter to match it.
Where to measure
Where the limit applies. Usually that is the mix position or a point the venue or authority names, sometimes the property line. Keep the microphone away from reflecting surfaces and out of the airflow of fans and doors, at ear height, and leave it in one place for the whole show: a log taken from a microphone that moved halfway through is two different measurements.
A routine for every show
- Calibrate at the start of the day with an acoustic calibrator, weighting off. See microphone calibration.
- Put the limit's metric on screen: for a limit of 100 dBA Leq over 15 minutes, a 15-minute A-weighted Leq. A meter that shows something else invites arguments.
- Set an alarm a little below the limit, so you hear about it before the venue does.
- Start logging before doors open. Keep it running through the support act and the changeovers.
- Write notes into the log: band changes, complaints, a level change you made and why.
- At the end, stop the log and keep the file and a report with the statistics.
What a laptop SPL meter can prove
A calibrated measurement microphone on an interface gives accurate readings for monitoring and documentation. It is not a type-approved sound level meter. Where a regulation or a dispute needs a certified instrument, use one, and use your log to show what you did between its readings. The accuracy of any reading also depends on the microphone, its calibration and the calibrator. A and C weighting at 44.1 and 48 kHz fall off early near 16 kHz, which matters little for music but is worth knowing.
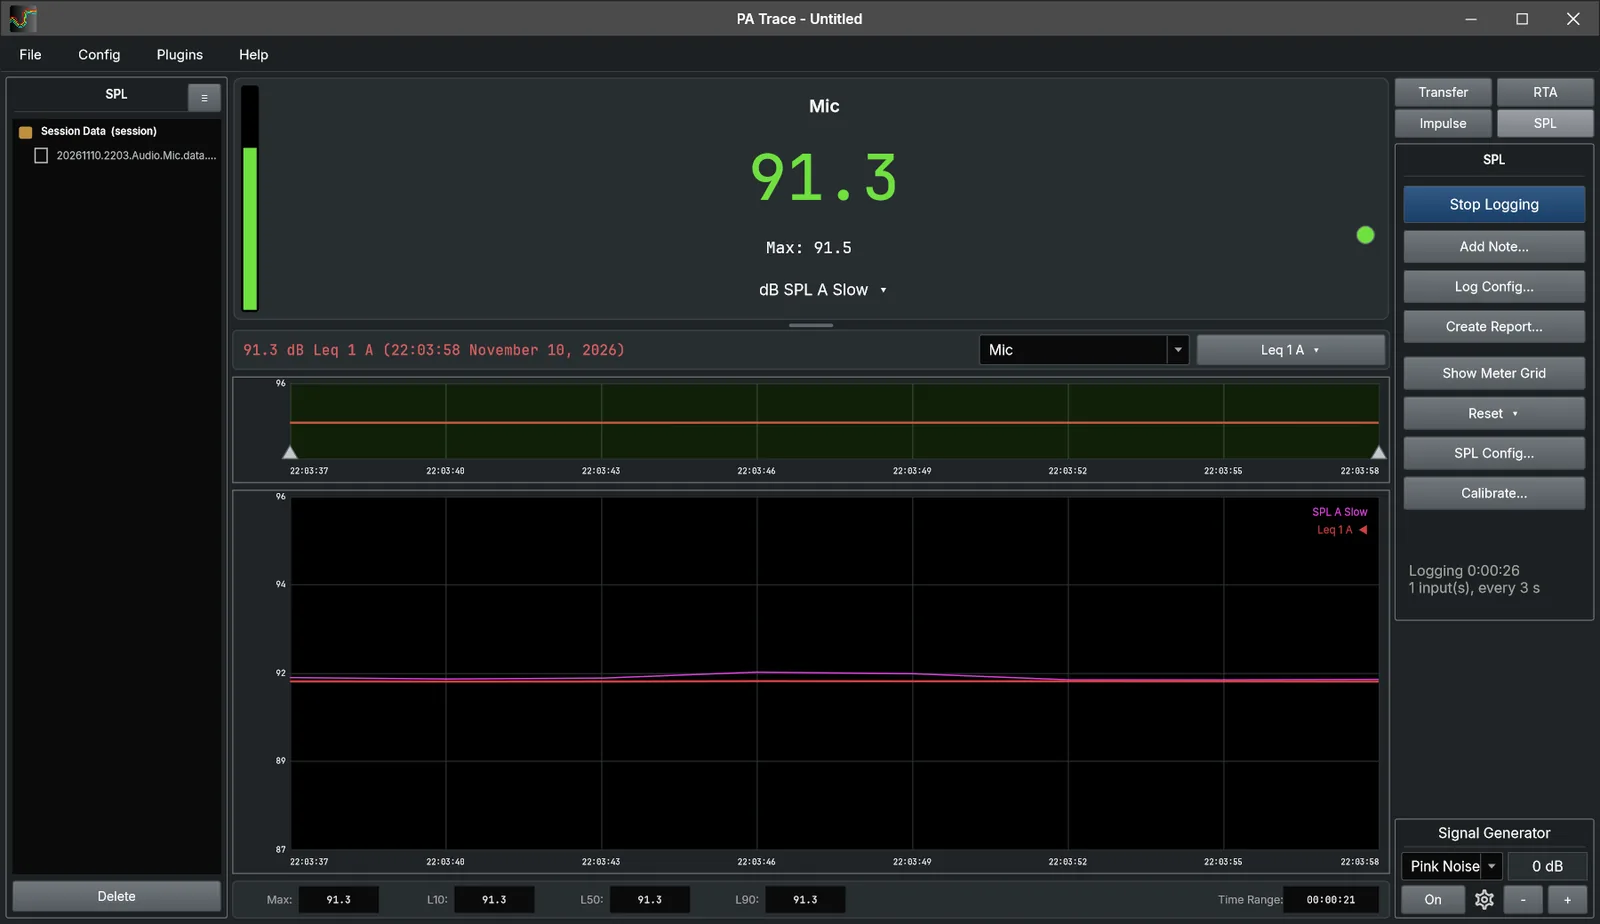
In PA Trace: SPL mode turns every calibrated input into a meter: SPL A, C or Z with Fast or Slow, Leq with any time from 1 s to 1440 min, Peak C, and NIOSH and OSHA exposure. Logging writes a text file per input, survives a restart, and Create Report... makes an HTML report with statistics, notes and alarms. The level can sit in the window title, and the meter grid (E) is made for a second screen at FOH.
Related guides
- Microphone calibration SPL calibration with a 94 dB calibrator, mic correction files, and when each one matters.
- Using an RTA What a real-time analyzer is good for at a gig, from ringing out feedback to checking a mix, and what it cannot do.
- Room acoustics: RT60 and STI Read the impulse response, measure reverberation time, clarity and speech intelligibility, and find the surface behind a reflection.
- Glossary Short definitions of the terms used in system measurement and tuning, from acoustic center to Wind Lock.