 PA Trace for live sound
How to use an RTA in live sound
A real-time analyzer shows the spectrum of one signal: what is in the room, at which frequencies, and how loud. It needs no reference, which makes it quick to set up and good at some jobs. It is also the wrong tool for system EQ, and knowing why saves a lot of confusion.
Updated 17 November 2026
What an RTA is, and is not, for
| Good for | Not for |
|---|---|
| Background noise surveys | Equalizing a system. An RTA shows the program as much as the loudspeaker: change the song and the curve changes. Use a transfer function for that. |
| Finding a frequency that is about to feed back | |
| The long-term balance of a mix during a show | |
| Checking a calibrator, a tone, or distortion |
How it works, and why pink noise reads flat
The RTA takes blocks of the input, fades each in and out with a window, and turns them into energy per frequency with an FFT. Those FFT points are spaced evenly in Hz, so a classic RTA sums them into fractional-octave bands: 1/1, 1/3, 1/12, up to 1/48 octave. The band display changes how signals look:
- Pink noise has equal energy per octave, so it reads as a flat line on a band display. A flat RTA with pink noise playing means system and room are flat at that point.
- White noise has equal energy per Hz, so it rises 3 dB per octave on a band display.
- Narrower bands hold less power. The same pink noise reads lower at 1/12 octave than at 1/3. A target curve written for one band width has to be shifted to compare with another.
Settings that matter
- FFT size sets the resolution. At 48 kHz, 16384 points (2.9 Hz) resolve 1/12-octave bands down to about 30 Hz. Use 32768 or 65536 for detail below 50 Hz, a smaller size for a faster display. See FFT size and time windows.
- Banding: 1/3 octave for overall balance, 1/24 or 1/48 to single out one frequency.
- Averaging: Fast (125 ms) follows the music; Slow (1 s) or a few seconds gives a readable picture of balance; an infinite average builds the spectrum of a whole song or set.
- Calibration: with a calibrated input the RTA reads dB SPL instead of dBFS. See microphone calibration.
The spectrograph
A spectrograph draws the spectrum over time as color, the newest slice on top. A steady tone is a vertical line. A frequency that keeps ringing after the music stops is a line that persists, which is exactly what feedback and resonances look like. It shows in a glance what the bars only hint at.
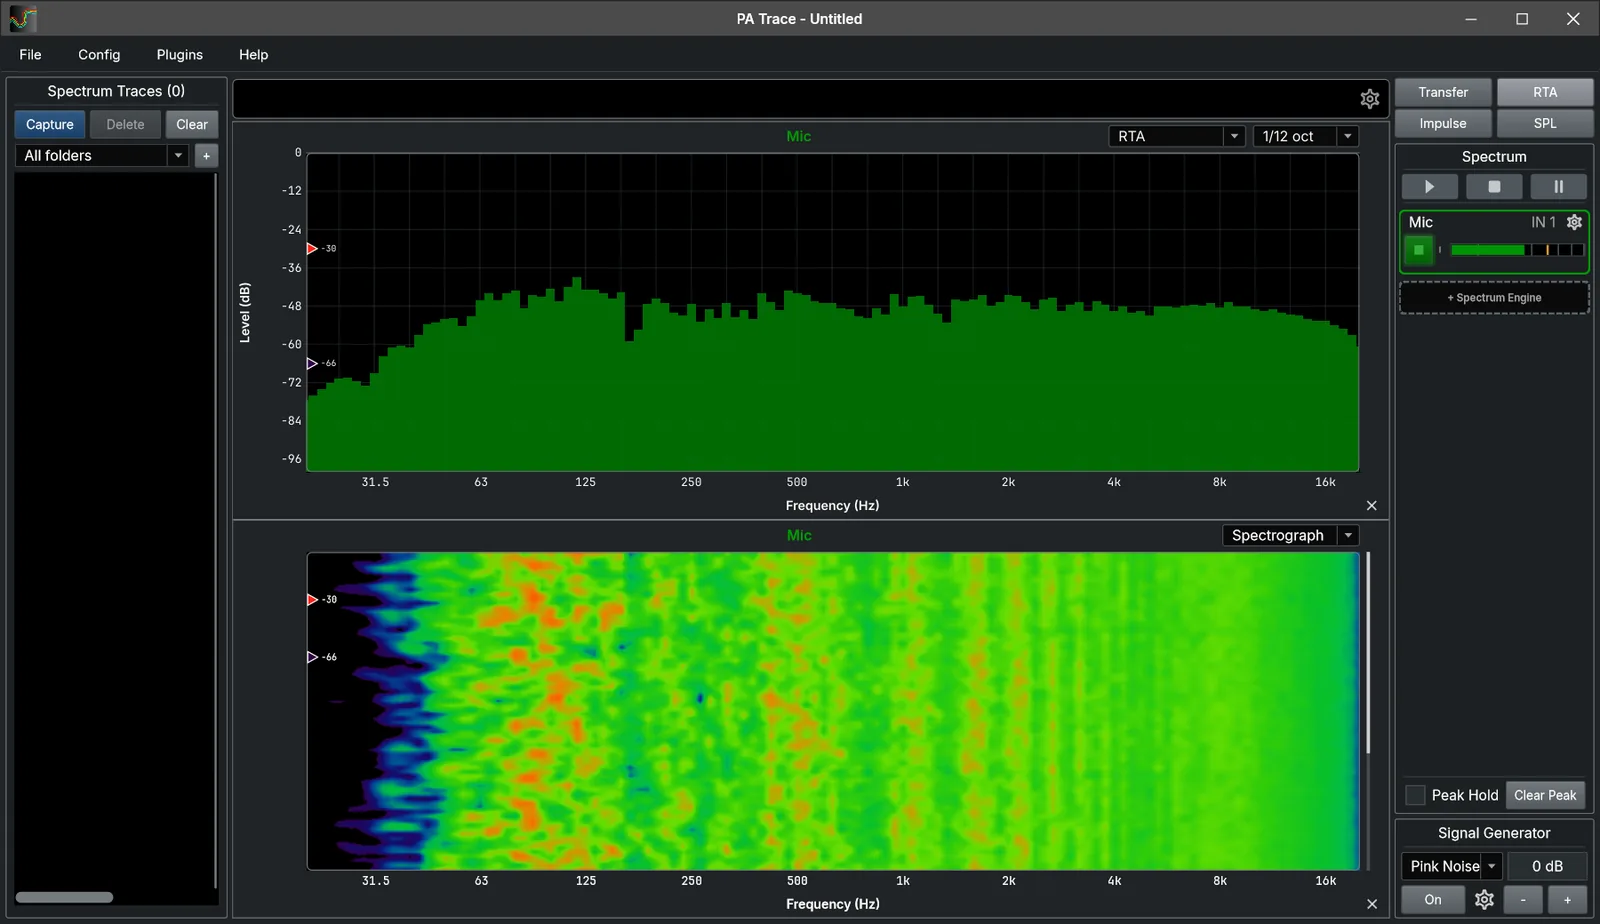
Background noise
- Calibrate the input so the display reads dB SPL.
- Set banding to 1/1 or 1/3 octave and the average to infinite.
- Let it run with the room in its normal state, air conditioning on, and compare with a noise criterion curve.
Finding feedback
- Set banding to 1/24 or 1/48 octave and averaging to none or Fast, so one frequency stands out.
- Turn on peak hold and peak tracking.
- Raise the microphone gain slowly. The frequency that grows faster than its neighbors and keeps ringing, a vertical line in the spectrograph, is the one about to feed back.
- Read its frequency and notch it on the processor or console, then look for the next one.
Ringing out brings a system close to feedback on purpose. Keep the level moderate and your hand on the fader.
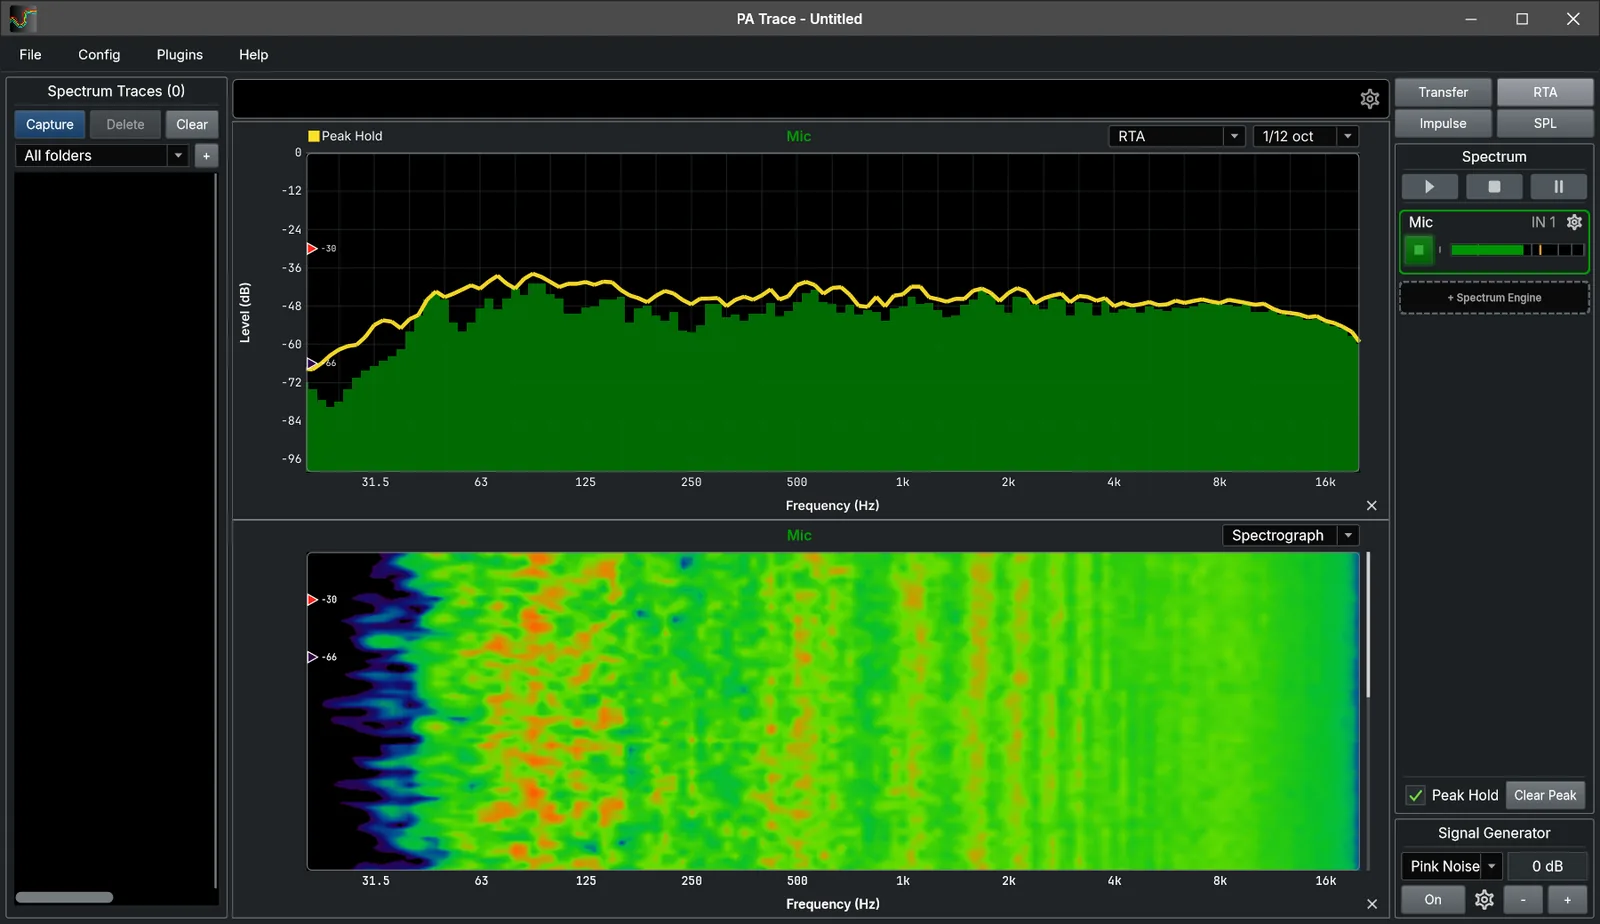
Tonal balance during a show
At the mix position, a slow average at 1/3 octave shows the long-term balance of the program. Compare it with a capture of a mix that sounded right, or with a target. Remember that the RTA mixes system and program: a bright song reads bright on a flat system. For decisions about the system during a show, run a transfer function with the console output as reference.
Distortion
Play a sine, set banding to 1/12 octave or finer, and read the harmonics at two, three, four and five times its frequency against the fundamental. That is total harmonic distortion. It means something only with a pure tone, and it measures the whole chain, so check the interface alone first.
In PA Trace: RTA mode runs one Spectrum engine per input, with narrowband or 1/1 to 1/48 octave banding, a spectrograph or 3D spectrogram, Peak Hold (P), Track Peak and Show THD. Target curves are shifted for the banding automatically. A phone running Remote Control shows the RTA too, so you can ring out monitors from the stage.
Related guides
- Transfer function measurement, explained Magnitude, phase, coherence and the impulse response: what they are and how to read them.
- FFT size and time windows Why one FFT size cannot serve the whole audio band, and how a multi-time window solves it.
- SPL monitoring dBA or dBC, Fast, Slow or Leq, and how to log a show so the numbers hold up when someone asks.
- Microphone calibration SPL calibration with a 94 dB calibrator, mic correction files, and when each one matters.