 PA Trace for live sound
How to measure a room: impulse response, RT60 and STI
The impulse response is the room and the system seen in time: when the sound arrives, which reflections follow it, and how long the room takes to go quiet. From it come the numbers that describe a room, reverberation time, clarity and speech intelligibility, and the answer to a practical question: which wall is causing that comb filter?
Updated 17 November 2026
What an impulse response is
It is what the microphone would record if the system were fed one infinitely short click. It holds the same information as the transfer function, seen in time instead of frequency. A dual-channel analyzer gets it from the transfer function with an inverse FFT, so you can measure it with noise, a sweep or program, without a real click. A hand clap or a balloon also works for a rough look, recorded as it is.
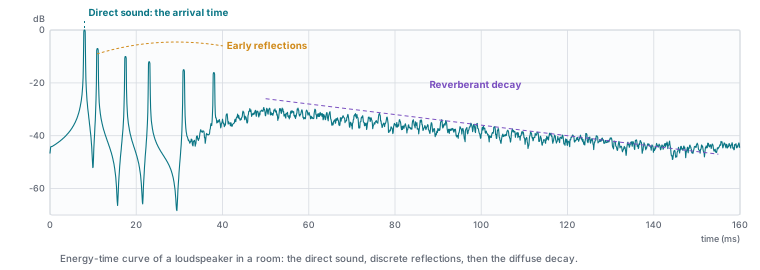
- Direct sound: the first and normally highest peak. Its time is the arrival time, about 2.9 ms per meter of distance.
- Early reflections: distinct peaks in the first tens of milliseconds from the floor, walls, ceiling and nearby objects. Each one causes a comb filter in the frequency response.
- Reverberant decay: a dense tail that dies away steadily. How fast is the reverberation time.
- Noise floor: where the decay meets the background noise. The distance from peak to noise floor limits how far down the decay can be evaluated.
Find the surface behind a reflection
A reflection's delay after the direct sound, times about 0.343 m per millisecond at 20 °C, is how much further it traveled. A reflection 10 ms after the direct sound traveled 3.4 m further. Compare that with the distances to the floor, walls and ceiling, and you know which surface to treat, or which way to aim away from. Its level below the direct sound says how deep the comb filter it causes will be.
Measuring the impulse response
- Make it long enough. The measurement must contain the whole decay, or the parameters are cut short. For most halls, 256k points (5.5 s at 48 kHz) is safe; for speech intelligibility use 5 s or more.
- Use periodic pink noise if you can. It repeats exactly once per FFT, so one run without averaging gives a clean response. With random noise or program, average 4 to 16 runs to lower the noise floor.
- Measure several seats. Reverberation time varies less from seat to seat than the frequency response, but clarity and speech intelligibility vary a lot.
Reverberation time: RT60, T20, T30, EDT
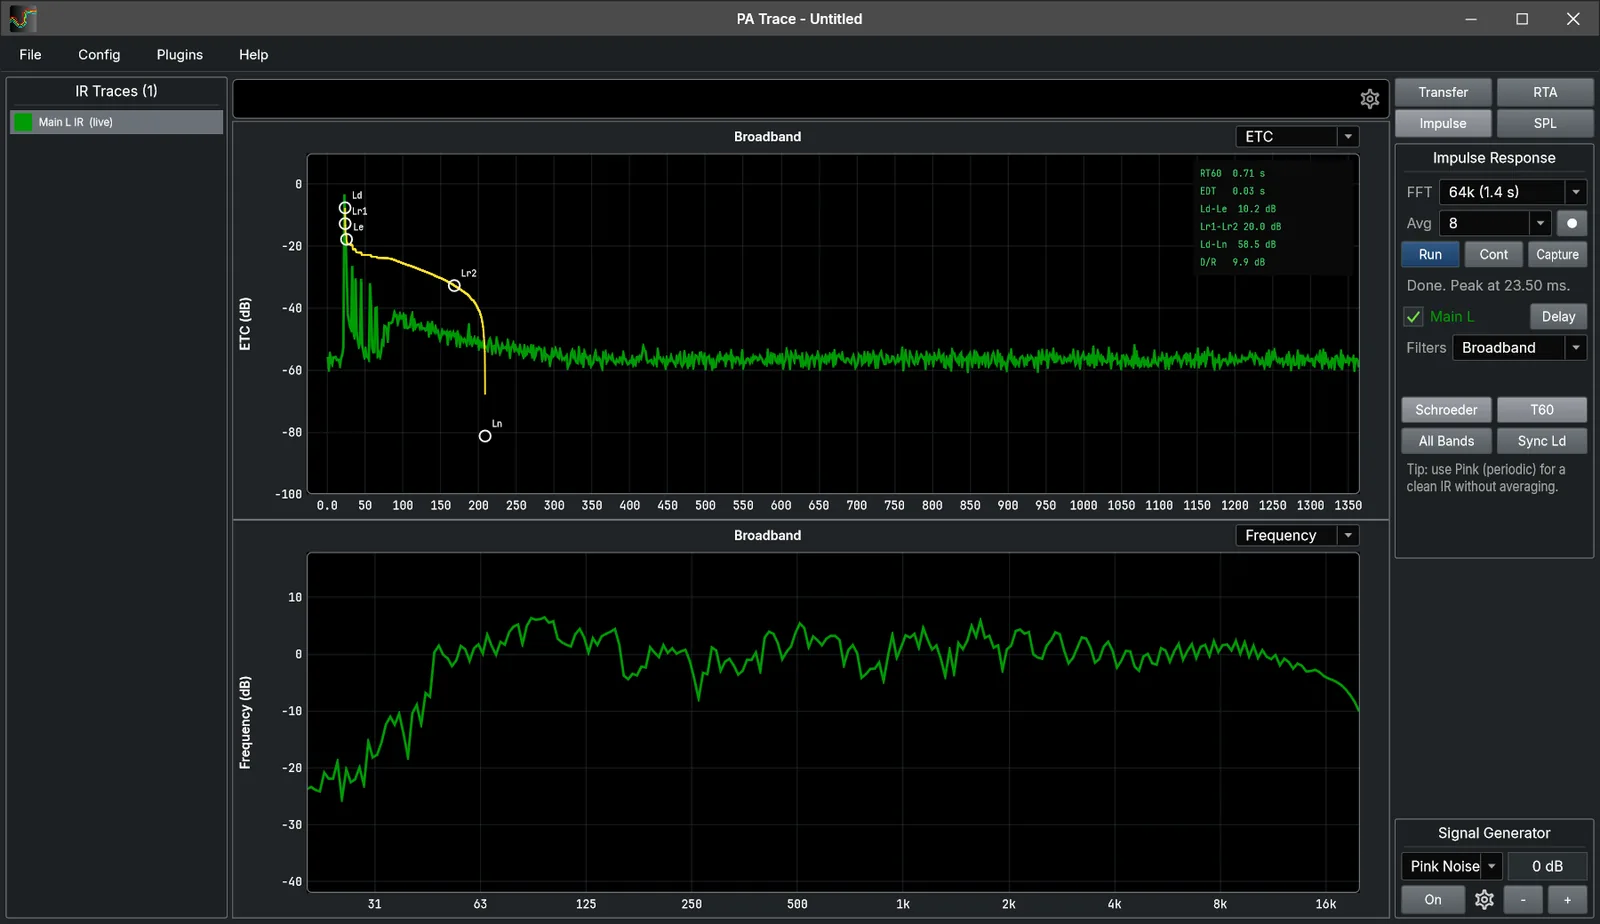
Reverberation time is how long the sound takes to decay by 60 dB. Rooms rarely give 60 dB of clean decay above the noise, so it is extrapolated from a shorter part of the backward-integrated (Schroeder) decay curve: T20 from a 20 dB range, T30 from 30 dB. EDT, the early decay time, uses the first 10 dB and is closer to how reverberant a room sounds.
- Speech rooms want short times; music halls longer ones.
- Compare low and mid frequencies (T Low, T Mid and the bass ratio): a long low-frequency decay tells you the low end will build up and the subs need restraint.
- A blank value usually means the decay was not long enough above the noise in that band.
Clarity and definition: C50, C80, D50
| Parameter | Meaning | Reading it |
|---|---|---|
| C50 | Energy in the first 50 ms against the rest, in dB | For speech; higher is clearer |
| C80 | Energy in the first 80 ms against the rest, in dB | For music; higher is clearer |
| D50 | Share of the energy in the first 50 ms, in % | Above about 50 % favors speech |
| Ts | Center time: the energy-weighted mean arrival time | Lower is clearer |
| D/R | Direct-to-reverberant ratio, in dB | Positive: the direct sound dominates |
All of these are measured from the same time zero for every band, as ISO 3382-1 describes. An analyzer that starts each band at its own filtered peak can shift low-band clarity by several dB.
Speech intelligibility: STI
The Speech Transmission Index (IEC 60268-16) runs from 0 to 1 and predicts how well speech will be understood. It depends on the room, but also on the speech level and the background noise. A system that measures well in an empty, quiet hall can fail with an audience and air conditioning.
- Without noise: enter the expected speech level and, if you have it, the background noise per octave from a calibrated RTA.
- With the real noise present: play speech-shaped noise at the operating level through the system with a calibrated microphone at the listener, and measure.
- Measure at the seats that matter, not only at the best one.
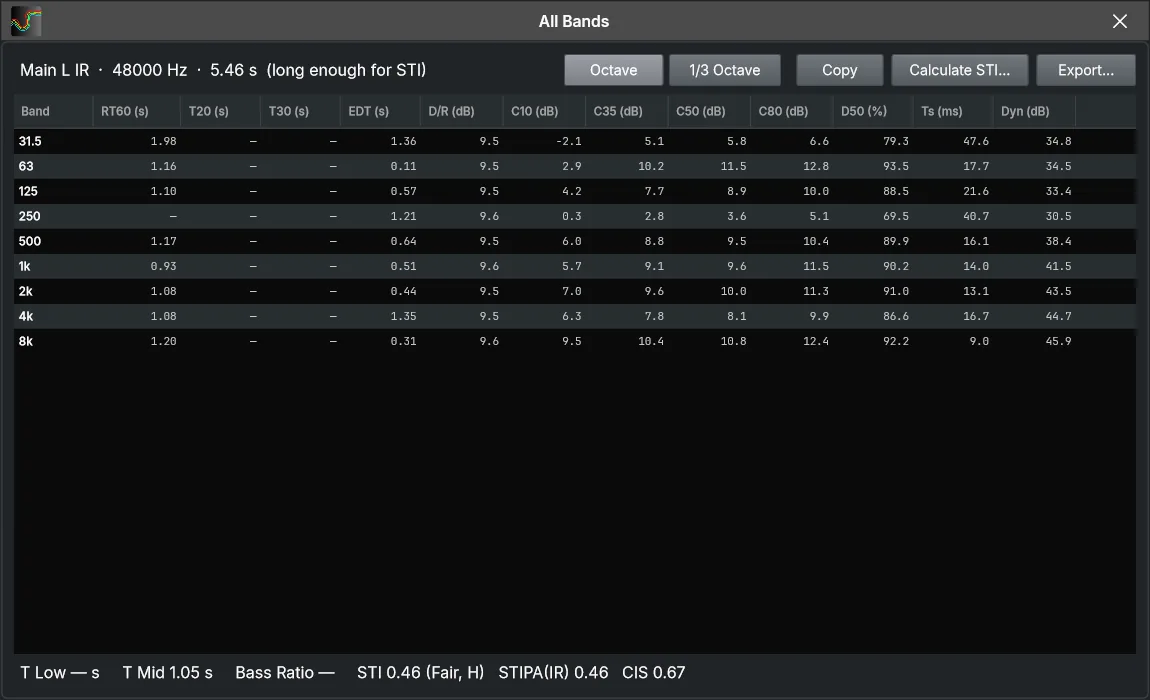
In PA Trace: Impulse mode measures each ticked Transfer engine (32k to 1M points, or 5 s for STI), places the Schroeder markers automatically (drag to correct), and lists RT60, T20, T30, EDT, D/R, C10 to C80, D50 and Ts per octave or 1/3 octave, with STI, STIPA(IR) and CIS. Copy pastes the table into a spreadsheet; impulse responses import and export as .wav.
Related guides
- FFT size and time windows Why one FFT size cannot serve the whole audio band, and how a multi-time window solves it.
- Delay speakers and fills Measure the arrival of each source where they overlap, delay the earlier one, and check the comb filter is gone.
- SPL monitoring dBA or dBC, Fast, Slow or Leq, and how to log a show so the numbers hold up when someone asks.
- Glossary Short definitions of the terms used in system measurement and tuning, from acoustic center to Wind Lock.