 PA Trace for live sound
FFT size, time windows and multi-time-window analysis
Every FFT analyzer makes a trade between frequency detail and time. Pick a long FFT and the low end resolves but the top turns ragged; pick a short one and the low end disappears. This guide shows the numbers behind that trade and how a multi-time-window analysis gets out of it.
Updated 17 November 2026
Two numbers from one setting
An FFT analyses a block of N samples at a time. At a sample rate fs, two properties follow:
- Frequency resolution = fs / N, the spacing between frequency points.
- Time window = N / fs, how much time each analysis looks at.
They are each other's inverse: fine resolution needs a long window. You cannot have 1 Hz resolution from 100 ms of audio.
FFT sizes at 48 kHz
| FFT size | Time window | Resolution | Good detail (about 10 points per octave) from |
|---|---|---|---|
| 2048 | 43 ms | 23.4 Hz | about 230 Hz |
| 4096 | 85 ms | 11.7 Hz | about 120 Hz |
| 8192 | 171 ms | 5.9 Hz | about 59 Hz |
| 16384 | 341 ms | 2.9 Hz | about 29 Hz |
| 32768 | 683 ms | 1.5 Hz | about 15 Hz |
| 65536 | 1365 ms | 0.73 Hz | about 7.3 Hz |
On a log frequency axis, as we hear, the points of a single FFT are spread evenly in Hz: sparse at the bottom and far denser than needed at the top. 4096 points give a usable curve from about 120 Hz, which leaves the whole subwoofer range unresolved.
Why one size does not fit
A long window resolves the low end, but it also takes in more of the room's reflections and reacts slowly. At high frequencies it gives far more points than are useful, and every late reflection shows as a notch: the curve becomes ragged and coherence drops. A short window is quick and steady at the top but blind at the bottom.
Wavelength is the reason. At 50 Hz one cycle lasts 20 ms and the wave is almost 7 m long; at 5 kHz a cycle lasts 0.2 ms. To see a low frequency you need to watch for many of its cycles; to see a high frequency without the room, you need to stop watching early.
The multi-time window
A multi-time-window (MTW) analysis runs several FFTs at once and takes each part of the spectrum from the window that suits it: long windows for the low octaves, short ones for the high octaves. The result has roughly the same number of points in every octave, and each frequency sees about the same number of its own cycles, which is closer to how we hear.
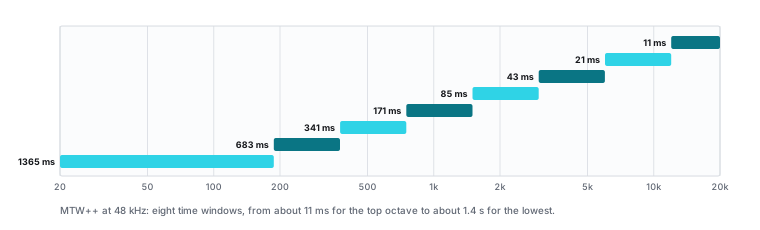
PA Trace's MTW++ builds this from a cascade of 512-point FFTs, each running at half the sample rate of the one above, stitched into one spectrum with a smooth crossfade. The bottom of the range reaches a resolution near 1 Hz. For system tuning it is the right choice nearly every time.
When a single FFT size still makes sense
- To compare with another analyzer set to a fixed FFT, so both curves are made the same way.
- For narrow detail at low frequencies with an RTA: 32768 or 65536 resolves below 50 Hz.
- For a display that reacts quickly: a smaller size updates faster.
- For an impulse response, where the length must cover the room's whole decay: often 256k points (5.5 s at 48 kHz) or more. See how to measure a room.
Window shape
Each block is faded in and out by a window function before the FFT, so its edges do not create false frequencies. Hann is the usual choice for noise and music. Flat Top reads the level of a pure tone most accurately, at the cost of a broader peak. Blackman and Hamming sit in between.
Averaging and smoothing are separate
FFT size decides what one frame can see. Averaging combines frames over time, which steadies the curve and lifts coherence in noise. Smoothing combines neighboring frequencies for display: 1/3 octave for tonal balance, 1/12 to 1/24 for narrow features. Smoothing changes only what you see; a captured trace keeps the measured data.
In PA Trace: the FFT setting in TF Config is MTW++ by default, or one size from 2048 to 65536, with Hann, Hamming, Blackman or Flat Top. Avg Depth (1 to 10) sets the averaging. With a single FFT size, MTW Coh takes the coherence from an MTW measurement running alongside.
Related guides
- Coherence explained What the coherence trace means, what each pattern of low coherence points to, and how to raise it.
- Transfer function measurement, explained Magnitude, phase, coherence and the impulse response: what they are and how to read them.
- Using an RTA What a real-time analyzer is good for at a gig, from ringing out feedback to checking a mix, and what it cannot do.
- Room acoustics: RT60 and STI Read the impulse response, measure reverberation time, clarity and speech intelligibility, and find the surface behind a reflection.